Every completed run produces one report. This guide explains how the report is laid out, how much you can trust its numbers, and where to look when you want to check a claim yourself.
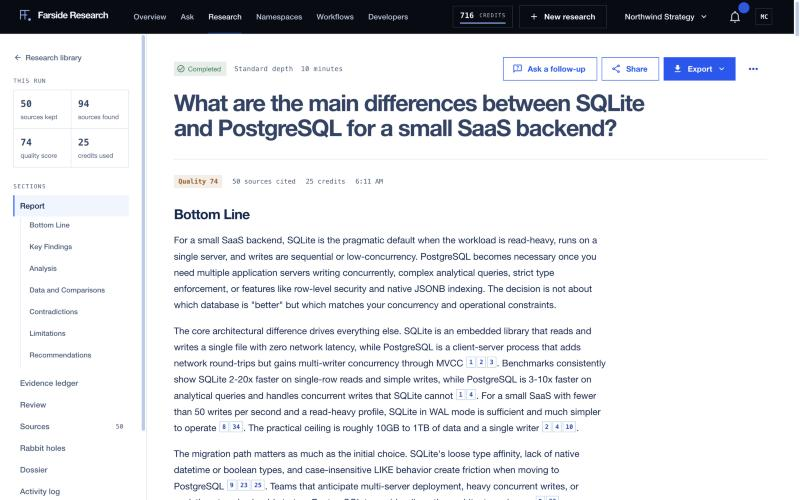
The outline
Every report uses the same headings, in the same order:
- Bottom Line: the answer in one to three short paragraphs. When the sources contain enough numbers, a key figures block sits right under it.
- Key Findings: up to eight numbered findings, ranked by importance. Each ends with a confidence label and a reason, for example "Confidence: Medium, one credible source".
- Analysis: one subsection per major angle.
- Data and Comparisons: tables, charts and timelines.
- Contradictions: where sources disagree and how the report resolved it.
- Limitations: what the evidence doesn't show, stale or thin areas, and what would change the conclusion.
- Recommendations: up to six specific actions.
The headings appear in the left sidebar under Report, so you can jump straight to Limitations before you trust the Bottom Line. Above the report you'll see the run's quality score, how many sources were cited, the credits it used and when it finished.
Tables, charts, key figures and timelines
Reports use four kinds of structured content:
- Tables for side-by-side comparisons.
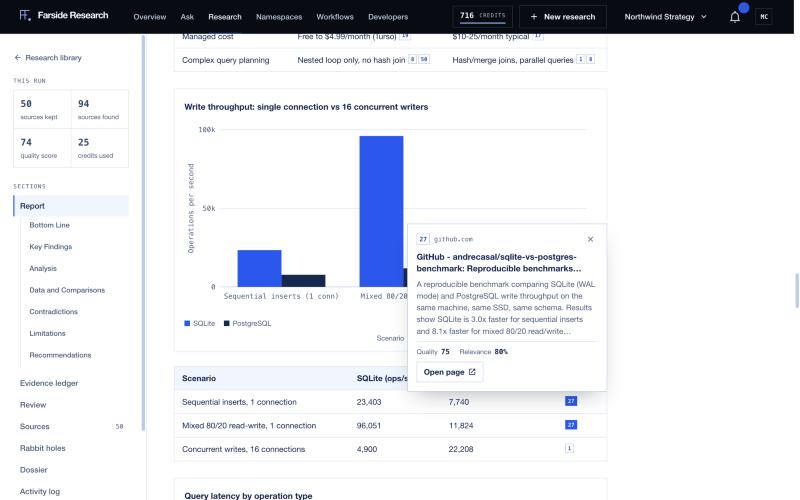
- Charts (bar, line or multi-line) when there are at least three comparable numbers. The same numbers are repeated in a table right under the chart.
- Key figures: three to six headline numbers, each tied to a source.
- Timelines for dated sequences of three or more events.
Charts and key figures are checked before the report is saved. Every number in them has to match a number stated in the evidence the writer received. The only conversion allowed is an exact monthly to yearly (or weekly to yearly) change when the label says so. If any value in a chart isn't in the sources, the whole chart is removed and the prose and tables stay. An unsupported key figure is dropped. Timelines aren't number-checked this way, so treat their dates like any other cited claim.
Citations and the source card
Numbers in brackets after a sentence are citations. Click one and a card opens with:
- the source number and its site,
- the page title,
- a short summary of what the page says,
- its Quality score and Relevance percentage,
- Open page, which opens the original in a new tab. Uploaded files show "Private or unavailable link" instead.
Sources
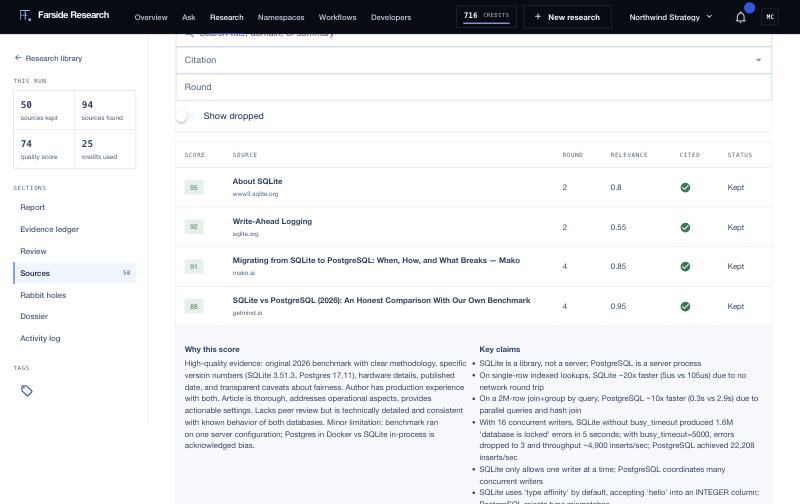
Open Sources in the sidebar for the full list. Each row shows the quality score (0 to 100), the source title and domain, the round it was found in, its relevance (0 to 1 here; the citation card shows the same value as a percentage), whether the report cites it, and its status. Expand a row to see its key claims and Why this score. You can search by title, domain or summary, and filter by citation or round.
A web source is kept only if it scores at least 45 on quality and at least 0.3 on relevance. Uploaded reference files only need the quality score. Duplicates are removed before the report is written. Turn on Show dropped to see what was found and left out. That's often the fastest way to check whether a source you expected was considered.
Open gaps and the evidence ledger
Evidence ledger gives a decision-readiness verdict, either "Ready for review" or "Evidence gaps remain", plus a list of checks: evidence volume, claim coverage, source quality, source relevance, source diversity, citation integrity, open evidence gaps, evidence freshness and counterevidence. Open evidence gaps counts the questions the run couldn't close. Read those next to the report's Limitations section before you act on it.
Review is where teammates comment on the report and approve it or request changes.
When the answer isn't enough
Under Keep digging at the end of the report:
- Ask a follow-up asks a question of this report's sources. See the Ask guide.
- Explore rabbit holes follows one direction in depth (20 credits each).
- Extend adds research rounds to the same report (40 credits).
If a run finished searching but the write-up failed, the report area says so and offers Regenerate (6 credits). It rewrites the report from the sources already collected, without searching again.
Exports
Click Export and pick a format: Markdown, PDF, Complete JSON or Sources CSV. Once a dossier is finished, Dossier Markdown, Dossier PDF and Dossier bundle appear as well. Exports run in the background and show in a tray above the report with a Download button. Exporting costs no credits. Your plan has to include the format, and trial workspaces can export, PDF included.
Sharing
Click Share to create a read-only link. You choose:
- when the link expires: 24 hours, 7 days or 30 days,
- Include sources,
- Include saved follow-up questions,
- Allow PDF download,
- Allow search engines to index this report (off by default; leave it off for client or confidential work).
Shared reports never expose uploaded files or their filenames. Revoke existing links cuts off every link for the report at once.